Skip to content

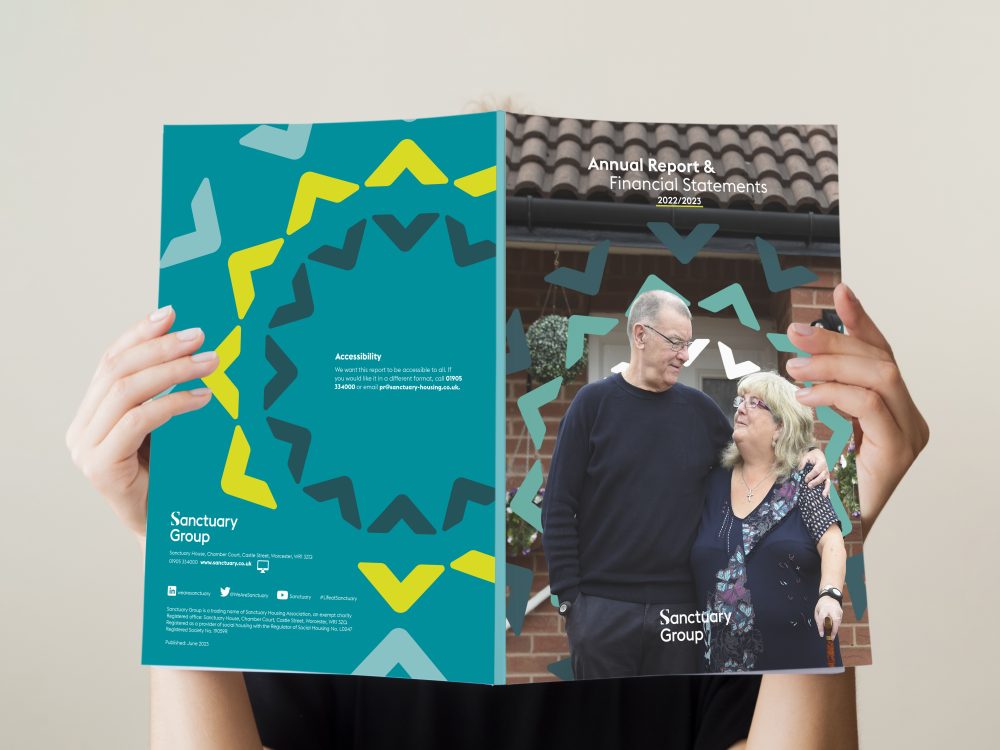
Annual Report & ESG Report Design

Got 80 pages of copy, three spreadsheets, six people making changes and a deadline that definitely isn’t moving? Welcome to report season.

Annual reports, ESG reports and sustainability reports can get complicated very quickly. There’s usually a lot of information, more than one audience and enough data to keep Excel busy for quite some time.

We take all of that and turn it into clear, engaging, accessible reports that people can actually find their way around. No decorating a Word document and calling it design; we make the information work.

Making complicated information look simple is the hard bit

The best reports don’t feel complicated, even when the information behind them really is.

A social housing annual report might need to work for residents, board members, regulators and colleagues. A public sector report could be explaining detailed performance information to senior teams and the wider public. An ESG report might contain targets, metrics, case studies, environmental data, governance information and enough spreadsheets to wallpaper the office.

Different reports, same challenge: what matters most, how do we make it easy to understand, and how do we stop the really important stuff disappearing on page 63? That’s where design earns its keep. We use clear hierarchy, strong editorial design, infographics, charts, imagery and good old-fashioned thinking to make complex information easier to absorb.

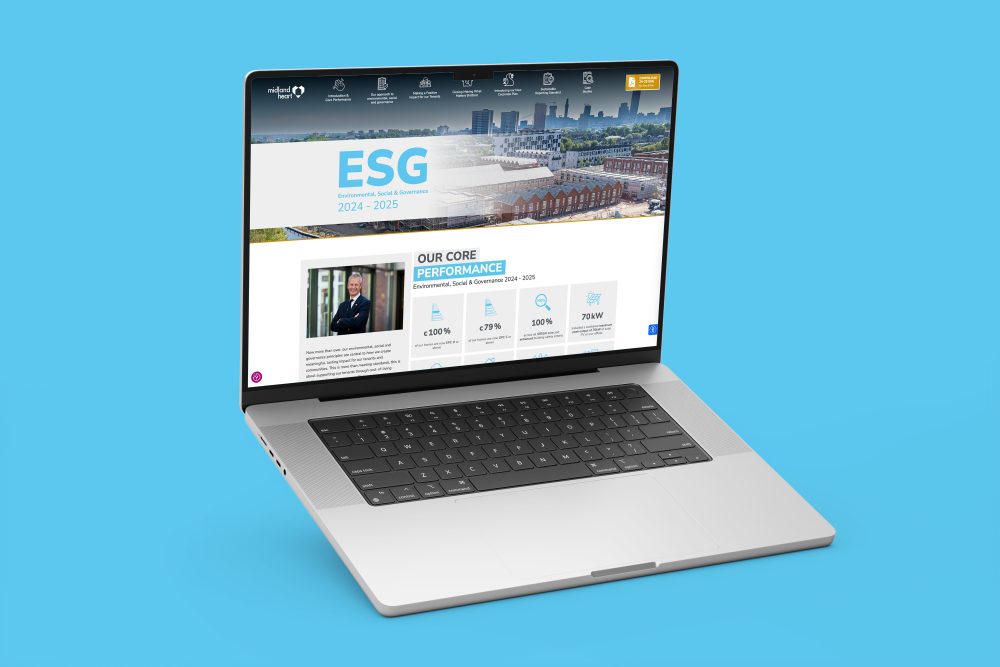
And sometimes the answer isn’t another PDF. We can turn annual, ESG and sustainability reports into dedicated microsites too, giving you something easier to navigate, richer in content and, particularly for ESG, much easier to update year after year. New figures, new targets and fresh case studies can be added without starting again from scratch.

Your report becomes a living communications tool rather than a file gathering digital dust in the downloads folder.

We’re brief makers, not brief takers

You can send us a finished Word document and tell us to lay it out, but if something doesn’t make sense, we’re going to ask:

We’ve been doing this for more than 30 years, and that experience means we know when to design, when to simplify and when to ask another question before anyone reaches for the mouse. Better briefs make better reports.

From "here’s all the content" to "can we send it?"

Depending on the project, we can help with:

Print, PDF, microsite or a bit of everything, we’ll build the right format around the people who need to
use it.

Editorial & Page Layout Design

Full publication concept, typography, grid structure, and visual hierarchy.

Data Visualisation & Charts

Transforming complex data sets and financial tables into clear graphs.

Custom Infographics

Custom illustrated diagrams and iconography to highlight impact and key achievements.

Accessible PDFs (WCAG 2.1 AA)

Fully tagged, screen-reader-friendly digital PDFs for public compliance.

Executive Summaries & Mini-Guides

Bite-sized highlight brochures and summary sheets for rapid distribution.

Report Microsites & Web Pages

Turning publication content into interactive web experiences.

Previous Report Work

And what does it cost?

A 24-page annual review and a 120-page ESG report are different beasts, so there isn’t one sensible fixed price.

Cost usually comes down to things such as page count, how much help the content needs, data visualisation, accessibility, number of stakeholders and whether we’re producing print, PDF, microsite or a combination.

We’ll scope it properly before we start, so you know exactly what’s included. We’ll also be publishing a dedicated Annual Report & ESG Report Pricing Guide later

FAQs

Yes. We work with housing organisations on annual reports, resident communications, ESG reports and performance publications.

Yes. We can support public sector organisations with annual reports, strategies, performance reports, consultation documents and other major publications.

Yes. We design ESG and sustainability reports for larger organisations, helping present complex information, data and case studies clearly and credibly.

Yes. We can take supplied data and turn it into charts, infographics and visual summaries that make complex information easier to understand.

Yes. Where accessibility is required, we recommend discussing it at briefing stage so it can influence the design from the outset.

Yes. Annual, ESG and sustainability reports can be turned into dedicated microsites or interactive digital reports that are easier to navigate and can be updated year after year.

Yes, and that’s often the best time to involve us.

Ready for report season?

If you’ve got an annual report, ESG report, sustainability report or major publication looming, bring us in early.

We’ll help untangle the brief, make sense of the information and turn the whole lot into something you’ll actually be proud to publish.